So, after a lot of planning, I finally managed to get general zip5 and zip3 support working in the GIPSEPoison service. I got it so that the service would only ever have to make two calls to the NPDS-poison service (one for states, one for zips) and that it could return zip3 and zip5 and state results simultaneously, and checked in the code after testing it.
The next thing I am planning to work on is some ant scripting for building and deploying the service in one simple command. The hope is that it will turn the install process for this service into a simple command thus turning about ten steps into about a two step process (one if you are repeating the process or just installing a patch).
Otherwise, it seems the farther future involves the generation of more services, more intricate installers, portals and other service/viewer aggregators. My hope is to just start creating things that make fetching and installing these items as easy as possible.
Cheers
Tuesday, September 29, 2009
Monday, September 28, 2009
Unsupported Class Version Error
The error:
Exception in thread "main" java.lang.UnsupportedClassVersionError: Bad version number in .class file
Explanation:
This happens when you have compiled a jar file with a newer version of Java and executing it with an older version of Java.
The Solution:
Either upgrade that Java version on the executing machine or recompile the code with the correct version.
Friday, September 25, 2009
Gridviewer deployment
The latest version of Gridviewer has been deployed this morning on the training node. It has all the latest security additions.
http://ncphi.phgrid.net:8080/gridviewer/
http://ncphi.phgrid.net:8080/gridviewer/
Thursday, September 24, 2009
Invalid Encoding Name in Tomcat 6
Here's an error message you may come across when deploying Globus to Tomcat 6. This error message happens when Tomcat is started.
SEVERE: Parse Fatal Error at line 1 column 40: Invalid encoding name "cp1252".org.xml.sax.SAXParseException: Invalid encoding name "cp1252".
Use the following procedure to correct the error:
1. Change directory to %CATALINA_HOME%\conf
2. Open tomcat-users.xml in a text editor
3. Look at the first line of the file and change encoding='cp1252' to encoding='utf-8'
4. Save the file and restart Tomcat
A web-based portal for PHGrid - Initial screenshots for discussion
I keep thinking about the public health workforce….and their most-likely perspective on our PHGrid activity. My thought is, what matters to them is that they are provided a new, robust and intuitive resource at their disposal that makes their work easier - not that it's a cool technology based on the globus toolkit, and leverages grid computing.
Thus, to better demonstrate to the public heath community the potential capability of the PHGrid architecture and ecosystem, I created some wireframe mockups articulating my thoughts around a web-based PHGrid portal. The goal of this is to demonstrate to users that PHGrid is not just about 1 GIPSE (aggregate data) service and 1 web-based geographic mapping "viewer" (i.e., a PHGrid Gadget)- but about a dynamic ecosystem potentially consisting of hundreds of different PHGrid resources (services, applications, Gadgets, etc) created by many and shared among many. This portal would provide a user-friendly, single, secure, access point to PHGrid resources (services, applications, Gadgets, Data, Computational power, etc.).
These wireframe screenshots are very crude….have many errrors, and are in no way exhaustive. They are at least a starting point for discussion.
Of course, there may end up being many more features of the portal - but I really do see it requiring 3 fundamental components:
1. General, secure, customizable PHGrid dashboard. I see this as a combination of MyYahoo, iGoogle, and iTunes for PHGrid. It combines, for example, social networking, eLearning, news, alerting, and statistics.
2. Real-time directory of available PHGrid resources. This combines features of an automated standards-based (UDDI) registry with integrated social aspects of eBay and Amazon.com. Users can quickly look for specific resources (services, applications, etc), examine their strengths and weaknesses, and ultimately request access to the resource. In other words, this part of the portal provides user-friendly access to a dynamic PHGrid resource ecosystem.
3. MyGrid - A user-defined PHGrid "workbench." This part of the portal allows users to customize a pallet of resources which are important / relevant to them - and which simplifies the process of organizing PHGrid resources.
Depending on the access control requirements - the user may be able to obtain immediate access to the resource- or may have to wait for the resource provider to grant access. Some resources may even require a document to be filled out and submitted. As can be seen in the Access Status feature of the site, this feature will allow the requesting user to monitor the status of his/her request - regardless of the specific process. Once the user has been granted authorization, he/she can use the Service/Gadget Automation tool to create ad-hoc and recurrent workflows / macros - tying together multiple resources. This would have aspects of both the taverna workbench and yahoo pipes. Clearly this area needs a lot of work..but I feel it may grow into a much larger aspect of the site.
Here is an example of a workflow (i.e., a macro) that could be created and saved - to be run at any time - or automated to run on a recurrent based:
After logging into the system with their secure credentials, a state epidemiologist goes to the MyGrid part of the portal. They then complete the following steps:
1. Requests specific data elements from data source X [service a]
2. Combines this data with data from source y [service b]
3. Runs a Natural Language Processing (NLP) engine on one data field from source y to convert a large chunk of text from a family history field into discrete coded data elements [service c]
4. Performs geospatial analytics on the newly generated data set z [service d]
5. Visualizes the analytic output using specific criterial [gadget e]
6. Creates images from the visualization tool and exports them to a web-based tool to be accessed by his/her colleagues at the local and county health departments within that state [service f and gadget g]
7. The user saves this workflow, and configures it to run every night at midnight.
I look forward to others thoughts on this. My hope is that we can create a very rough mock-up of this in the near future. It's my belief that it is only through the creation of a resource such as this, that we can clearly articulate the real value of PHGrid's robust, secure, SOA-based architecture / ecosystem to the overall public health community, and not just to the IT and informatics savvy public health workforce.
Thanks! Tom
Wednesday, September 23, 2009
Many SDN deploys and GIPSEPoison tweaks
So, I finally got the "All Clinical Effects" element working in GIPSEPison... which effectively, if selected, tells the poison service to return all the human call volume for a given region instead of a particular clinical effect.
The next step is to get zip5 and zip3 working. I plan to do it the same way I did it in quicksilver: ask for all the counts of a state and then filter out the zipcodes I don't need. If zip5 is selected, just copy into the observations, but if zip3 is selected, bucket aggregate the zip5s. Ironically, having the whole state return grouped by zipcode is a lot easier than trying to list a long set of zip5s for an entire state (as would be the case with most gridviewer zip3 searches).
I also made a little zip3 to state properties file... in the hopes of not needing the geolocation database (and saving installation steps).
Otherwise, I have also been helping a lot with deploys and scans for various targets... which has caused lots of discussions about ways of automating things so that less time is taken up by these things which are going to be more frequent. The hope is that we can just tell someone about a build label and have someone hit "go" with that variable set and whatever needs to be deployed will get deployed automagically.
Either way, that is not the only improvement being discussed. I get the feeling that soon next week a whole lot of cool new services and visualizations are going to start getting hammered onto and into various design tables.
Cheers,
Peter
Tuesday, September 22, 2009
H1N1 Dashboard
While not technicaly PHGrid, the Novel H1N1 Collaboration Project's Enrollment Dashboard is an interesting approach to data visualization that may filter into PHGrid prototypes for visualization.
You won't be able to view the dashboard since it's not public, but the multi-layer google map is pretty interesting.
You won't be able to view the dashboard since it's not public, but the multi-layer google map is pretty interesting.
Saturday, September 19, 2009
neuGRID Project Video Demonstration
A video demonstration of the neuGRID project and platform is available
at: http://www.youtube.com/watch?v=fpfD6GZ90tQ&v=30
for more information, contact:
David Manset
CEO MAAT France (maat Gknowledge Group)
Immeuble Alliance Entrée A,
74160 Archamps (France)
Mob. 0034 687 802 661
Tel. 0033 450 439 602
Fax. 0033 450 439 601
dmanset@maat-g.com www.maat-g.com
Friday, September 18, 2009
Gridviewer improvements
We were able to complete a few substantial improvements to the Gridviewer application. The changes listed below were deployed on the training node (http://ncphi.phgrid.net:8080/gridviewer/):
- Added download csv extract functionality per query request. (Click on Download Data to get an extract)
- Added HTML data table display with sortable columns per individual query request as well as a combined data set . This feature is currently needing improvements in speed. Further improvements could contain subtotaling by regions or dates. ( Click on Display data link to see control. )
- Corrected bug in the console log with the time displays.
- Appended build version on the title and header.
Wednesday, September 16, 2009
GSA launches portal where agencies can buy cloud computing services
Full article here:
Kundra's great experiment: Government apps 'store front' opens for business
http://fcw.com/articles/2009/09/15/gov-apps-store.aspx?s=fcwdaily_160909
Direct link to the new service:
Tuesday, September 15, 2009
GIPSE Request Examples
I've received another requests for better documentation on the GIPSEService requests (what stratifiers are used for what, better examples, etc.). So I will create something soon and post to this blog.
In the meantime, the JUnit tests run through a series of examples in google code that may help a little against the NCPHI node.
In the meantime, the JUnit tests run through a series of examples in google code that may help a little against the NCPHI node.
Friday, September 11, 2009
Got GIPSEPoison working on the training node.
So, after many months of on-again, off-again trying... I finally managed to figure out the library conflict on the training node that was preventing GIPSEPoison from loading up on the training node.
The library ended up being WSDL4J. The CXF libraries being used by Jeremy Espino's awesome NPDS Client needed a newer version of wsdl4j than the one that was provided with Globus. Luckily, the newer version seems backwards compatible.
Thus, GIPSEPoison can now be seen as an option in http://ncphi.phgrid.net:8080/gridviewer/
If you read some of my earlier posts, you'll know that the first step was to import the libraries separately (rather than as a part of a Jar-with-dependencies). Otherwise, the error seemed to indicate a WSDL or some other parsing error, and WSDL4J was the first duplicate jar I tried.
The next couple of days are going to be spent fixing up GIPSE Poison. Giving it an "all clinical effects" option, and zip3 and zip5.
Cheers,
Peter
Tuesday, September 8, 2009
PHIN Conference Thoughts.
Greetings all,
It has been a week since the PHIN conference started with a long weekend in-between, and today I wanted to list out the impressions I got from the crowd and the panels and the discussions I had there... Then I hope to expand a bit with my notes and more thoughts in future blog entries.
- Impression the first(e): Where are the users?
At least two of the panels I attended could be summarized as "this/those informatician(s) used that/those cool grid technolog(y/ies) and find it helpful in doing there work, now if we could only get more of those technologies and work on making them talk to each other". The panels showed me several things. The most important is that informaticians, doctors, and users in general knew that there was stuff out there and they were using it to make their lives easier (IE, "Peter feels validated"). The next coolest thing we learned is that the users had very good opinions and suggestions about how the products could be made to better suit their needs... and the final point I realized is that while many of the fine-grained steps in the process were different (each health department has a different end data format and a different way of describing what they consider to be 'flu'), a lot of the general needs were the same (speed, ease of use, customizability, ease of interaction with other services). I feel that this shows the need to find as many of the users as possible and to try and create a very good space for them to have their opinions and needs voiced, and hopefully help each other install and adjust GRID-like products to suit those needs.
The other user impression I got is that PHGrid, as users of things like Globus and CAGrid (Introduce), are getting a lot of things needed from those programmers and communities. Globus is coming out with cool new things that solve a lot of the old problems, CAGrid is improving Introduce to match the new version(s) of Globus and answering the "how do we create a grid without having to buy lots of expensive third party certificates and how do we simplify registration/addition of new nodes" problems. CAGrid is also looking into ways to remote-deploy services to user boxes so they can run analysis or other functions on data that cannot leave their organization.
- Impression the second(e): We should do the things to make it easy for users even if it makes our lives more difficult.
Several of the panels included the phrase "at our local health department... we tend to see flu like this... but next door, they see flu like this...". In short: "Two health departments, three classifications". In addition, local health departments are wary of attempts to take large chunks of their data so that someone else can re-classify the data. But, they are fine with setting up a service that only gives summary data (no patient info, just counts). Furthermore, they don't have much trouble going "when the service asks for an aggregate count of flu, we'll give them an aggregate count of what we think flu is". Furthermore, they like the idea of having services that allow them to re-organize or re-classify data so it matches a standard, so long as they don't have to email large files or mail DVDs to some place outside of their control.
This means, the biggest impediment to using these types of services is probably going to be the major learning curve required to install all the various toolkits (globus, CABig, tomcat, certificates) and the various configurational complexities to all the applications. The more time we spend making an installer, the less time we have to spend on the phone with interested health departments telling them how to set it up. That also goes for how easy we make it for health departments to write the queries into their own database(s) or datasets. Finally, we need to focus on allowing for customizable outputs from the service viewers we create. If someone can go to GridViewer and get a sample of data to make sure that the CSV we spit out will be able to be read by their analytics... that will help save them some time in a word-processor.
Thus, installers, view panes, things that centralize and simplify configuration and installation with the obvious stuff up front and the complicated stuff defaulted but in an obvious place for modification. Think firefox. Think google.
- Impression the Third(e): Everyone is really happy that all the stuff is relatively open, free (as in speech), and everyone is acquainted with each other and thinking of ways to collaborate and suggest improvements.
If we make a service builder, we will probably be extending CAGrid's introduce. Dr. Jeremy Espino is tweaking globus service projects with Ivy so one doesn't have to upload various libraries into a repository. Globus is new and probably going to be using CXF instead of Axis which will probably improve everything and make us impromptu beta-testers, and a lot of people seem to be marvelling at Quicksilver and Gridviewer and looking forward to their improvements.
So generally, the PHIN conference helped me focus on what I think we need to be doing for the next year, namely getting ready and making our stuff flexible enough for a lot of users to do a lot of different things to make their statistical and analysis efforts easier.
Friday, September 4, 2009
Sparklines
This weeks build includes the following:
1. Moved flot chart out of Marker info window and into greybox for improved UI.
2. Corrected loading image bug
3. Corrected hidden markers reappearing when new query submitted bug
4. Corrected date range selection bug
5. Added sparkline graphs per region with ability to change chart type.
6. Improved show/hide on region selections and filter selections
7. Modified ajax request flot calls per changes on server-side for facilities/datasources
Not happy with the way the site is rendering in IE7, but it is an inferior product anyway. When possible, use Mozilla/Webkit..
Tuesday, September 1, 2009
2nd iteration..always room for improvement
I am happy with the number of improvements made to the UI of gridviewer in the few weeks we had. We eliminated post-back calls to the server for every query, we developed custom pin overlays, added service areas and ages into the query parameters, redesigned the layout and made a considerable number of general aesthetic changes. This 2nd release represents what is possible utilizing agile and of course, javascript.
On that note, I would like to point out my current thoughts on future improvements.
1. Charts: The first gridviewer used the pin info windows to display region specific chart data. We maintained that in the 2nd release. The issue with this design is the info window is too large for the scale of the map. It is my opinion that we move the chart out of the map completely into a dynamic layer around the form. This would prevent all the dragging of the map to see the whole chart.
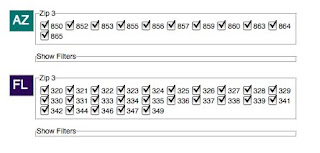
2. Primary navigation: I waver on how important the map actually is to the user. When I first began working on gridviewer, my original impression was the map should serve as the primary navigation, meaning they should use the map for drilling into all the query results. Now I actually believe the map is really a subordinate to the query result boxes (see image below). My opinion is we should expand the current boxes to include more informative data results such as simple bar charts showing zip totals, or possibly show a sparkline for each respective zip. A user should be able to click on AZ, get a chart for that collection as well as have the map zoom into that respective region. As the user selects items either pins on the map or check-boxes in the query boxes, each respective control is responding that event accordingly, meaning the map zooms in and out and the chart data changes based of the selected region. As others have mentioned, a data download should be available per query box as well.
3. Form
I wonder if we could reorganize the form selection box to have an "advanced options" selection which would reveal(show/hide) the age, dispositions and service areas. It seems that age and dispositions could default to all and service areas should mostly be driven by the classifier selection. It would be less intimating to the user and also would provide more space.
4. Comments
One suggestion was for commenting which I am really in favor of. I believe before we implement this we must have the ability for people to generate links to a saved query. It would not be a large hurdle to have one URL per query (box), but to have a single URL for multiple queries is going to represent a challenge. We could look to using something like ShareThis once we have the URL issue worked out.
On that note, I would like to point out my current thoughts on future improvements.
1. Charts: The first gridviewer used the pin info windows to display region specific chart data. We maintained that in the 2nd release. The issue with this design is the info window is too large for the scale of the map. It is my opinion that we move the chart out of the map completely into a dynamic layer around the form. This would prevent all the dragging of the map to see the whole chart.
2. Primary navigation: I waver on how important the map actually is to the user. When I first began working on gridviewer, my original impression was the map should serve as the primary navigation, meaning they should use the map for drilling into all the query results. Now I actually believe the map is really a subordinate to the query result boxes (see image below). My opinion is we should expand the current boxes to include more informative data results such as simple bar charts showing zip totals, or possibly show a sparkline for each respective zip. A user should be able to click on AZ, get a chart for that collection as well as have the map zoom into that respective region. As the user selects items either pins on the map or check-boxes in the query boxes, each respective control is responding that event accordingly, meaning the map zooms in and out and the chart data changes based of the selected region. As others have mentioned, a data download should be available per query box as well.

3. Form
I wonder if we could reorganize the form selection box to have an "advanced options" selection which would reveal(show/hide) the age, dispositions and service areas. It seems that age and dispositions could default to all and service areas should mostly be driven by the classifier selection. It would be less intimating to the user and also would provide more space.
4. Comments
One suggestion was for commenting which I am really in favor of. I believe before we implement this we must have the ability for people to generate links to a saved query. It would not be a large hurdle to have one URL per query (box), but to have a single URL for multiple queries is going to represent a challenge. We could look to using something like ShareThis once we have the URL issue worked out.
Subscribe to:
Comments (Atom)

